Can AI read charts? Research says not yet.
Posted by Giang Son | Mar 29, 2025 | 4 min read
Summary a study on the chart understanding capabilities in LVLMs.
Findings from: Do LVLMs Understand Charts? Analyzing and Correcting Factual Errors in Chart Captioning (Huang et al., Findings 2024)
LVLMs and Image Captioning
Generative AI models come in different shape and forms. Most popular models nowadays take natural language as an input and so they are called large language models (LLMs), think early versions of ChatGPT. But, the world isn’t just text, so some models are trained to understand both text and images. These are called large vision-language models (LVLMs).

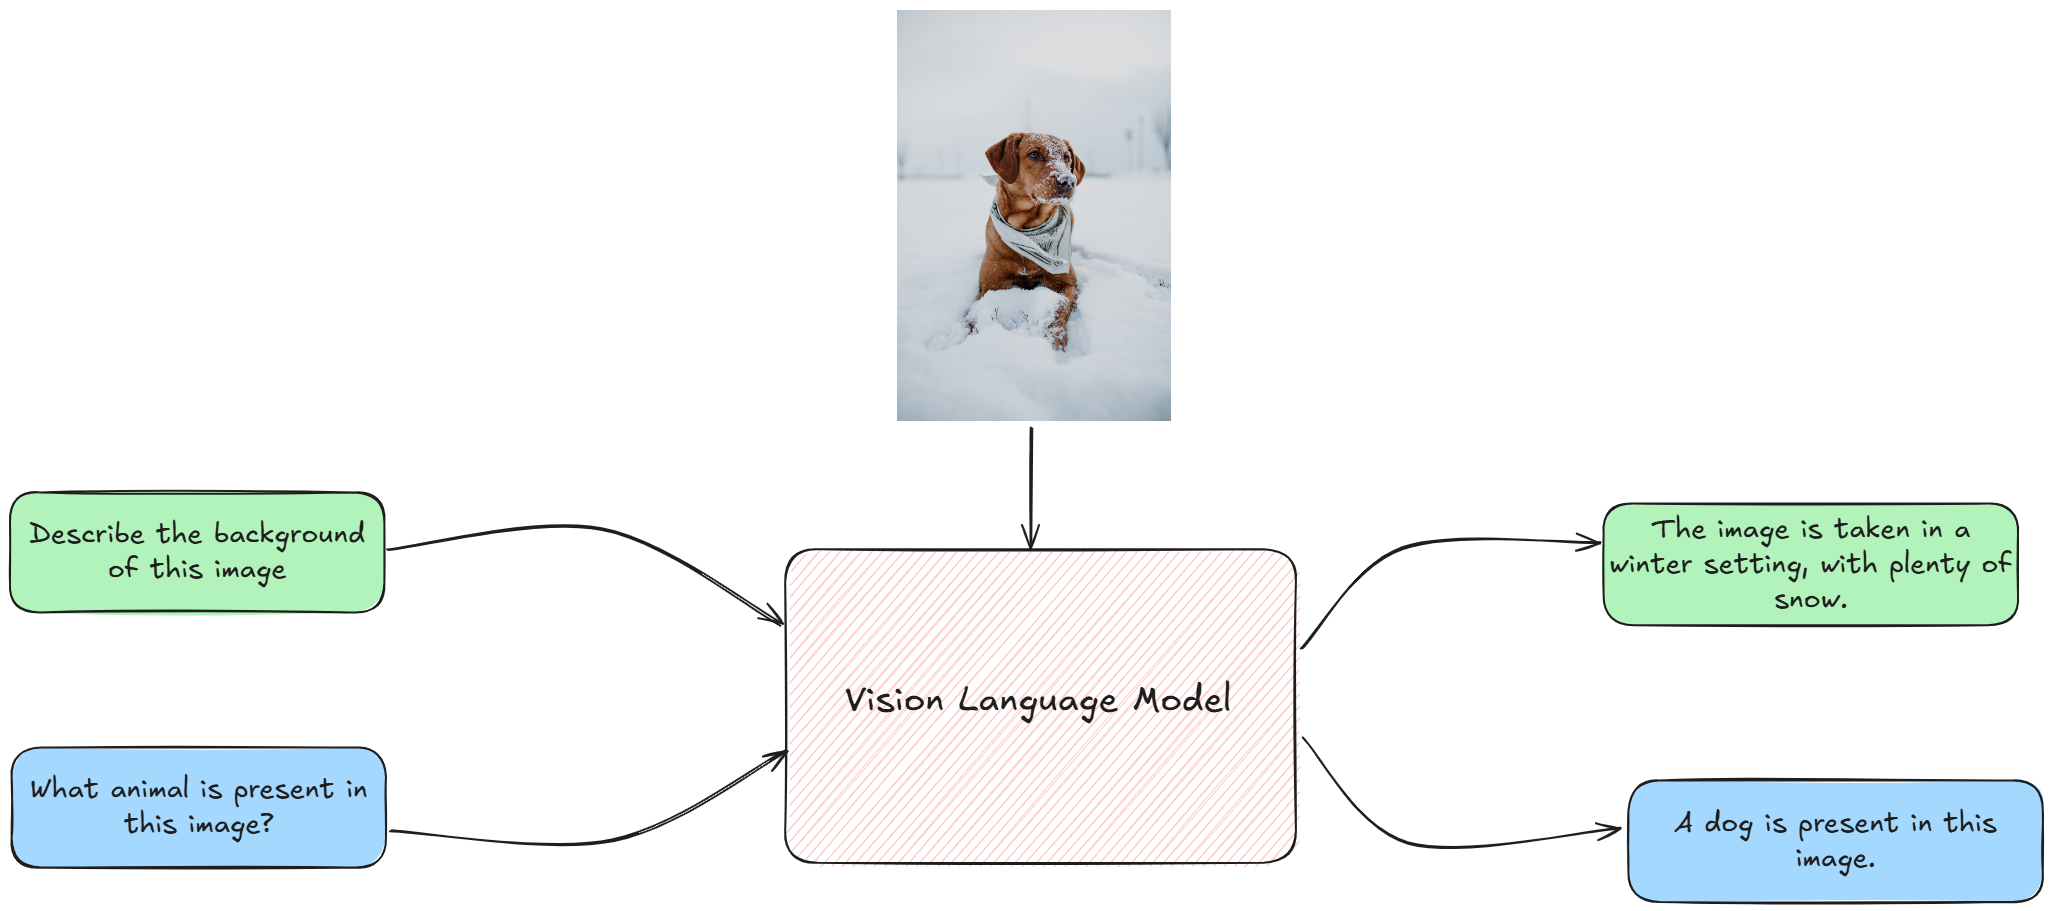
Example of LVLM's visual question answering capabilities. (image source)
LVLMs are powerful and they can do all sorts of useful things. You could describe a thing and ask a model to generate a picture (text-to-image, like DALL-E or Midjourney). You could ask questions about an images and the model will give some answer (like the case above). Or, you could upload a image and ask a model to describe it for you (image captioning).
Now imagine if the image you need described is… a chart (think: data visualization) and the description you need is an analysis of that chart. The model can do that. It is quite a tempting idea, which could potentially displace data analysts’ jobs. If only it works as intended…
Do LVLMs Understand Charts?
So I recently came across Do LVLMs Understand Charts? Analyzing and Correcting Factual Errors in Chart Captioning. This paper tried to assess whether the state-of-the-art vision-language models (*) can generate faithful captions for charts. The short answer is: No, LVLMs cannot generate factual captions.

Example of a non-factual caption: Notice how all the things are just wrong.
Here’s what they did: the authors used 2 large datasets of chart images, and they ask the latest models to generate a caption (which can be made up of many sentences). Then, they asked humans to evaluate whether a sentence is factually consistent with what’s in the image, and if not, what sort of error it makes.

They found out that a staggering 82.06% of AI-generated captions are factually incorrect (they contain at least one non-factual sentence). And about half of the generated sentences are non-factual.

They also analyzed the how well (or in this case, how poorly) the models do on different types of error.

(*) Models in this experiment include: Task-specific fine-tuned models (ChartT5, Matcha and Unichart), LLM-based pipeline (DePlot + GPT-4), and LVLMs (GPT-4V and Bard)
What Can be Done?
The paper proposed C2TFEC, a framework to correct factual errors in chart captioning. Basically, instead of just asking a LVLM to generate captions, we first convert the image to a data table (using chart-to-table model, like UniChart), and use another reasoning model to correct the errors based on that table.

This two-step process is relative effective in correcting the incorrect captions. For example, here is a corrected caption for the chart given about. The numbers and labels and orders are actually correct now.

However, this method is still far from perfect. This is the evaluation after corrections: the error rate is lowered but not yet zero.

Would you accept a data analyst that reads charts wrong, say, 5% of the time? I absolutely would not. So, ext time you want to use AI for chart-reading, you may need to think twice since even the best models are prone to errors.
So yeah, the data analysts out there can breath a sigh of relief 😅 (for now).